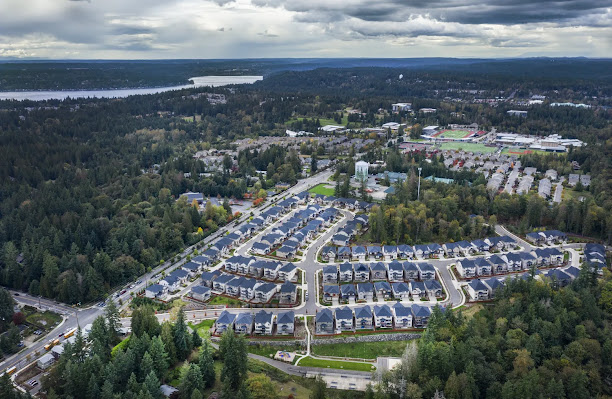
Kirkland Homes Sale Statistics
Are you looking for Kirkland homes for sale statistics? If yes, then you are at the right place. In this article, we are going to share Kirkland Homes Sales Statistics of 2022.
The real estate market is very competitive these days. People want to get into homes buying or selling faster than ever before. This has led to a surge in the number of houses being sold.
There are several ways to get information about current housing trends, such as through local newspapers, websites, and even social media sites. However, there are some things that cannot be found out from those sources.
Properties Sold
- Property sales were 133, up 13.7% from 117 in 2021
- It was also 16.7% higher than the 114 sales last month.
1. Neutral Average Sold Price per Square Footage
The average price per square foot is a good indicator for the direction of home prices. Since median sold price and average sold price can be impacted by the mix of high or low end homes in the market, the average sold price per square footage is a more normalised indicator of the direction of home prices than either median sold price or average sold price.
- In 2022, the average sold price of $786 was down 2.1% from $803 last month
- It was also up 21.3% from $648 of last year, reflecting the continued downward trend in home prices.
2. The Average For Sale Price is Neutral
- The average sale price was 2,570,000 dollars, up 17.1 percent from 2,195,000 dollars of 2021
- Surprisingly, It remained the same as last month.
4. The Median Sold Price is Depreciating
- The median sold price was $1.5 million, up 13.2% percent from $1.325 million of 2021
- But compared to lat month it was down 15.3% percent from $1.771 million.
Inventory
A relatively low number of months of inventory is generally more favorable for sellers while a high number of months of inventory tends to benefit buyers.
- Buyer’S Market: More than 6 months of inventory.
- Seller’s Market: Less than 3 months of inventory.
- Neutral Market: 3 – 6 months inventory.
Inventory Based on Closed Sales
- The 2022 months of inventory based on closed sales of 0.7 was decreased by 74.7% from last year
- It was down 18.1% from last month.
Inventory based on Pended Sales
- The 2022 Months of Inventory based on Pended Sales was increased by 204 percent over the previous year.
- It also grew 68.6 percent compared.
Pended Properties
- There was an increase of 15.2% in the pended properties, with 121 properties versus 105.
- Whereas the pended property sales were 6.2% lower than last year's.
Absorption Rate
In real estate investing, the absorption rate refers to the percentage of buyers who purchase a property within 30 days of seeing it listed. This number is very important because it shows whether or not the seller has priced their home correctly. If they haven't, you can expect a lower absorption rate.
Absorption rates vary depending on the type of property being sold. For example, single-family homes tend to have higher absorption rates than condos. Also, properties in desirable neighborhoods sell faster than those in less desirable areas.
1. Absorption Rate Based on Closed Sales
- The 2022 Absorption Rate based on Closed Sales was 134.3 % decreased by 46% vs last year.
- It also decreased by 25.8% vs last month.
2. Absorption Rate Based on Pended Sales
- The 2022 Absorbence Rate based on Pended Sale of 97 was decreased by 66.7% compared to last year
- It fell down by 43.4% compared to last month.
The Days on Market Shows Neutral Trend
The average Days on Market shows how many days an average listing is on the market before selling. A downward trend in DOM means that properties are moving off the market faster, indicating a move towards more of an Investor’s market.
- The DOM was 10, up 100% from 5 days last month.
- It was also down 28.6% from 14 days compared of last year.
The Sold/Original List Price Ratio is Stable
The Sold Price vs Original List Price reveals the percentage of the selling price being reduced from the original list price. The higher the number, the greater the demand for the product.
- In case, the current ratio is 105%, down 6.2% compared to last month
- Fortunately it is somehow the same level as of last season.
Final Words
When it comes to buying a home in Kirkland WA Real Estate, there are some great deals out there. Prices have been steady throughout the year and appreciation rates have increased. Some experts believe the market could begin selling homes above the asking prices by the end of the month. Realtors are optimistic this could soon happen.
More Similar Blogs
- Kirkland Homes Sale Statistics of August
- Bellevue Housing Market Forecast, 2022
- Tips For Seattle Home Buyers Entering The Market
- Real Estate Marketing Ideas to Bring in Qualified Buyers
- 5 Must-Haves In Your Real Estate Buyers’ Consultation


Comments
Post a Comment